
The bond market is a complex financial market that plays a vital role in providing information to traders and investors about the state of a country’s economy. Essentially, a bond is a loan given by the public to the government or a corporation, in return for a fixed interest rate. When investors purchase a bond, they are essentially lending money to the issuer for a specific period of time, typically ranging from a few months to several years.
Bonds are widely used by governments to finance their activities, such as building infrastructure or funding social programs. As such, the bond market reflects the health of a country’s economy and the perceived creditworthiness of its government. The interest rate on a bond reflects the risk that investors perceive in lending money to the issuer, with riskier issuers offering higher interest rates to compensate investors for the higher risk.
The bond market provides valuable insights into the future risks associated with a government and its economy. For example, if investors believe that a government is becoming more risky, they may demand a higher interest rate to compensate for the increased risk. Conversely, if investors believe that a government is becoming less risky, they may demand a lower interest rate.
Traders and investors closely monitor the bond market to gain insights into the direction of the economy and to make investment decisions. By analyzing the yields and prices of different bonds, traders can gauge market sentiment and make informed decisions about their investments. In particular, the bond market is closely watched by those who trade foreign exchange (forex) currencies, as it can provide valuable clues about the health of a country’s economy and the direction of its currency.
Analyzing Bonds: Key Parameters and the Yield Curve
The yield curve is a critical tool for investors and analysts in understanding the bond market’s behavior and assessing the overall health of the economy.
To better understand this, let’s consider an example.
Suppose you are an investor looking to purchase a bond from a government. You have two options: a short-term bond that matures in a year and a long-term bond that matures in ten years. The short-term bond offers an interest rate of 2%, while the long-term bond offers an interest rate of 4%.
As an investor, you may wonder why the long-term bond carries a higher interest rate than the short-term bond. The answer lies in the inherent risk associated with longer-term investments. The economy may experience various ups and downs in the next ten years, and there is a higher likelihood that interest rates may rise or fall during that time. This uncertainty poses a risk to investors, who demand a higher return for taking on that risk. In contrast, short-term bonds are less exposed to market fluctuations and carry less risk. Hence, the interest rates on short-term bonds are lower.
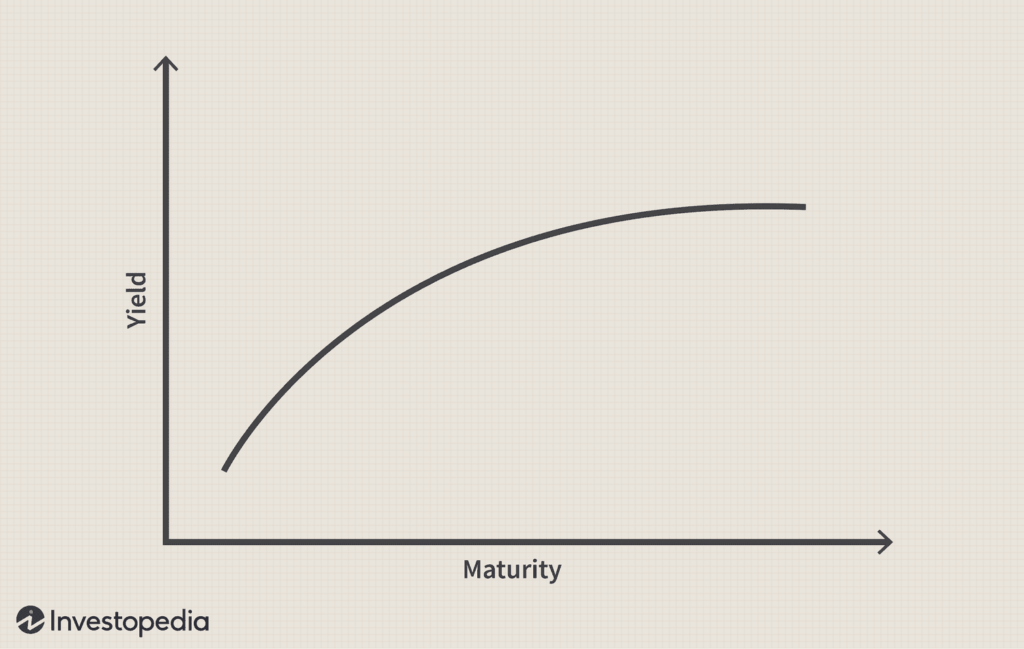
Now, let’s take a closer look at the yield curve. The yield curve is a graphical representation of the relationship between the maturity dates of bonds and the interest rates they offer. In a typical yield curve, short-term bonds offer lower interest rates compared to long-term bonds. This positive yield spread is called a “normal yield curve” and occurs during times of economic growth and stability.
However, the yield curve is not static and can shift based on market conditions and economic indicators. For instance, during an economic recession, investors may fear that interest rates will drop, and they may shift their investments from long-term bonds to short-term bonds. This shift results in a decrease in the yield spread, leading to a flattening of the yield curve. On the other hand, an inverted yield curve, where short-term bonds offer higher yields than long-term bonds, often signals an upcoming recession.
Using the Yield Curve in Forex Trading
The yield curve is an essential indicator for Forex traders, as it provides valuable information about a country’s economic outlook. When trading currency pairs like EUR/USD, GBP/USD, or any other pair that involves a particular country’s currency, traders analyze the yield curve of that country’s bonds to make informed trading decisions.
For instance, if a Forex trader is trading the EUR/USD currency pair, they would focus on the Eurozone yield curve, particularly the interest rates associated with German bonds. Germany has the largest economy in the Eurozone and is considered a benchmark for the region’s economic stability. Therefore, German bonds’ yields are closely monitored and have a significant impact on the Euro’s value.
Similarly, when trading the British pound, Forex traders would focus on the yield curve of British bonds or gilts. The yields on British bonds provide insights into the market’s perception of the UK economy and the Bank of England’s monetary policy.
By analyzing the yield curve, Forex traders can gauge the health of a country’s economy and adjust their trading strategies accordingly. A positive yield curve, where long-term bonds have higher yields than short-term bonds, may indicate a healthy economy and could signal a bullish market sentiment. On the other hand, an inverted yield curve, where short-term bonds have higher yields than long-term bonds, may indicate an economic slowdown or recession and could signal a bearish market sentiment.
Paying Attention to Country Yield Curves
In the world of trading, turbulence can arise due to various factors such as political instability, economic uncertainty, or unexpected events. During such times, the bond market can be a valuable source of information for traders and investors.
One key aspect that traders should pay close attention to is the yield curve, which is a graphical representation of the relationship between interest rates and the maturity dates of bonds. In normal times, longer-term bonds carry a higher interest rate compared to short-term bonds, due to the inherent risk associated with longer-term loans. However, in times of turbulence, the yield curve can shift, and the difference between the yields of long-term and short-term bonds can increase.
Countries with higher levels of uncertainty may offer higher yields on their bonds, which compensate investors for the extra risk they are taking on. This can be seen in the yield curves of these countries, which can reach new highs or new lows. Traders should keep a close eye on these yield curves, as they can offer valuable insights into the state of a country’s economy and the level of risk associated with investing in that country’s bonds.
For example, during the global financial crisis of 2008, the yield spread between long-term and short-term bonds in the United States widened significantly, as investors sought the safety of longer-term investments amid market turbulence. In Europe, the yield spreads of countries such as Greece and Portugal widened significantly during the Eurozone debt crisis, reflecting increased risk and uncertainty in those economies.
Using the Yield Curve to Predict Recessions
The US economy plays a crucial role in shaping the global financial market, and as a result, traders and investors around the world closely monitor economic indicators and market movements in the US. One of the most important indicators is the US yield curve, which reflects the relationship between interest rates and the maturity dates of US Treasury bonds.
The yield curve is an essential tool for traders and investors, and it can provide valuable insights into the state of the US economy. In particular, the spread between the interest rates on the ten-year Treasury note and the three-month Treasury bill is closely watched as a predictor of economic recessions.
When the spread between these interest rates is positive, with the ten-year note yielding more than the three-month bill, it is referred to as a “normal yield curve.” This typically indicates a growing and stable economy, with investors willing to lend money for longer durations at higher interest rates.
However, when the spread between these rates becomes negative, with the three-month bill yielding more than the ten-year note, it is referred to as an “inverted yield curve.” This is often seen as a warning sign of an impending recession, as investors are willing to lend money for shorter durations at higher interest rates due to increased uncertainty and a lack of confidence in the long-term economic outlook.
Traders and investors use the yield curve to gain insights into the health of the US economy and to make informed decisions about trading strategies. In fact, research has shown that the yield curve is a powerful predictor of future economic activity, often outperforming other financial and macroeconomic indicators in forecasting recessions two to six quarters ahead.
Alternative Measures of the Yield Curve
The yield curve, which is a graphical representation of the relationship between interest rates and the maturity dates of bonds, is a crucial tool for traders and investors to analyze market conditions and predict economic growth. While the 10-year versus 3-month Treasury spread is a popular measure of the yield curve, it is not always the best indicator during times of low interest rates, as we’ve seen in recent years.
As such, traders have looked to other measures of the yield curve, such as the difference between the 30-year Treasury and the 5-year Treasury. This spread provides insight into the medium-term expectations of the market, as it covers a wider range of maturities than the 10-year versus 3-month spread.
Another useful measure of the yield curve is the 10-year versus 2-year spread. This spread captures the expectations of the market for future economic growth. When the 10-year yield is significantly higher than the 2-year yield, it indicates that the market expects strong economic growth in the future. Conversely, a narrow spread or inversion may suggest the possibility of an economic slowdown or recession.
The Importance of the Shape of the Yield Curve
There are three main types of yield curve shapes: normal, inverted, and flat (or humped). In a normal yield curve, longer-term bonds have a higher yield compared to shorter-term bonds. This is because investors are compensated for taking on the additional risk of holding onto the bond for a longer period.
In an inverted yield curve, the opposite is true, with shorter-term yields higher than longer-term yields. This phenomenon is often a sign of an upcoming recession or economic slowdown. This is because investors are seeking safety in short-term bonds, leading to increased demand and higher yields. Meanwhile, long-term bonds are less attractive as investors worry about the future economy, leading to decreased demand and lower yields.
A flat yield curve occurs when the shorter and longer-term yields are very close to each other. This can be a predictor of an economic transition, such as a shift from a period of economic growth to a slowdown.
The slope of the yield curve is also seen as important. The greater the slope, the greater the gap between short- and long-term rates. A steep slope is generally seen as a sign of economic growth, while a flatter slope can indicate economic uncertainty or a potential downturn.